DC10 Implementation of IGA in the design and analysis workflow of machine elements and systems:
Although the basic principles of IGA are known for some decades, its application in industry is less spread than one would expect considering its fundamental advantage: the representation of real surfaces in a well-defined mathematical way instead of a discrete non-smooth finite element mesh.
Progress was made in FEM and IGA simulation studies using advanced workflows, including ANSA-Epilysis-META, ANSA-LSDYNA-META, and ANSA-Kratos-Rhino, for tensile test specimen analysis. The results validates against theoretical and experimental data.
1 Test different workflows
According to [Tuo21], the test specimens, shown in Fig 1(b), are fabricated from a DP900 steel sheet with a thickness of 1.5mm, a gauge length 55mm, a Young’s modulus E=207,600MPa, and a Poisson’s ratio ν=0.3. The uniaxial tensile test was conducted on an MTS universal tensile machine with a maximum load capacity of 100kN, Fig 1(a). Boundary conditions were applied such that one end of the specimen was fully fixed, while the opposite end was subjected to axial displacement at a loading rate of 2.0 mm/min. The tensile specimen exhibits complex mechanical behavior under tensile loading, including elastic deformation, yielding, plastic deformation, and fracture. The force–displacement curves is shown in Fig 1(c).
Our study focuses on the elastic deformation stage. As shown in Fig 1(c), for displacements ≤0.04 mm and uniaxial forces ≤3kN, the response demonstrates a clear linear elastic behavior.
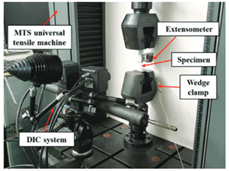
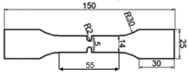
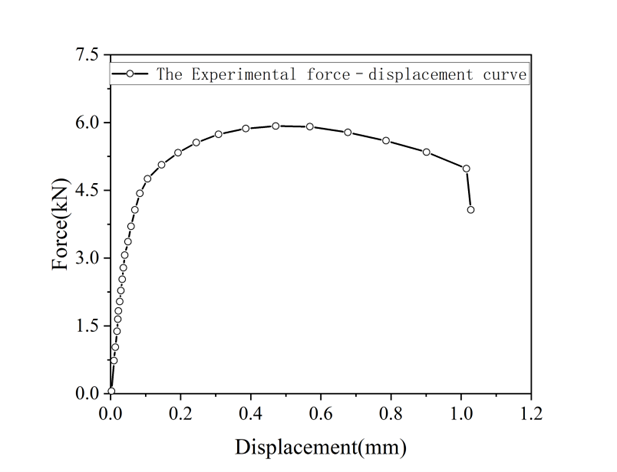
Figure 1: Test specimen model [1]
Experimentally, Fig 1(c) shows when F = 3KN, the displacement is 0.0398mm. While Fig 1(c) is obtained by point-pick from the reference paper, which contains acceptable physical error.
Theoretically, the elongation Δx and stress σ are calculated by formula:
Δx = FL/EA
σ = F/A
Where F is the tensile force, L is the effective length, E is the Young’s modulus, A is the initial cross-sectional area.
According to Fig 1(a), only the elongation of the gauge length 55 mm is considered. The theoretical elongation calculation is organized by three parts, as shown in table 1.
Table 1: Theoretical elongation calculation
| Cross-sectional area(mm^2) | Effective length (mm) | Elongation Δx (mm) |
| 14mm*1.5mm | (55-4)/2 = 25.5 | 0.0175 |
| 5mm *1.5mm | 4 | 0.0077 |
| 14mm*1.5mm | (55-4)/2 = 25.5 | 0.0175 |
| sum | / | 0.0427 |
The nominal stress at the notch cross-section is 400 Ν/mm^2. The stress concentration factor 1.62[Pe08] should be considered, so the maximum stress at the notch is 648 Ν/mm^2.
In the subsequent analysis, the elastic deformation of the notched tensile specimen will be simulated using different workflows.
1.1 ANSA-Epilysis-META Workflow
In this section, a comprehensive FEM process ANSA–Epilysis (Nastran SOL101)–Meta workflow is used to simulate the linear static analysis of the specimen. The left end of the specimen is fully fixed, and a 3 kN force is applied along the axial direction. The volume elements simulation obtains the elongation of the gauge 0.04779 mm and the maximum stress in the notch region 692.878 Ν/mm^2. The shell elements simulation obtains the elongation of the gauge 0.04795 mm and the maximum stress in the notch region 675.179 Ν/mm^2. Results shows shell elements simulation will fulfill the analysis requirement.
1.2 ANSA-Lsdyna-Meta workflow
In this section, trimmed-IGA-based ANSA-Lsdyna-Meta workflow is used. Lower polynomial order and refined mesh can be a good strategy to avoid the cross-talk effect in the notched part. In this case, biquadratic polynomial order and 1mm span are used. The simulation obtains the elongation of the gauge 0.04785 mm and the maximum stress in the notch region 635.151 Ν/mm^2.
1.3 ANSA- Kratos -Rhino workflow
Additionally, IGA-based ANSA–Kratos–Rhino workflow is used. The IGA trimmed model and the boundary conditions are consistent with Section 1.2. The ANSA–Kratos plugin generates the input data (5 JSON files) required by the Kratos solver. Then Kratos performs the simulation and produces the result files which will be visualized by Rhino–Crocodile plugin. The simulation obtains the elongation of the gauge 0.0476 mm and the maximum stress in the notch region 655.35 Ν/mm^2.

Table 2: Results from experiment, theory and different workflows
| Method | Min mesh size (mm) | Elongation (mm) | Max stress (N/mm^2) | Deviation from Experimental elongation (%) |
| Theoretical | / | 0.0427 | 648 | 7.29 |
| Experiment | / | 0.0398 | / | 0 |
| FEM Volume elements | 0.15 | 0.04779 | 692.878 | 20.08 |
| FEM Shell elements | 0.15 | 0.04784 | 675.179 | 20.2 |
| IGA (LSDYNA) | 1 | 0.04785 | 635.151 | 20.23 |
| IGA (Kratos) | 1 | 0.0476 | 655.35 | 19.6 |
Table 2 shows details of simulation results. The findings demonstrate that IGA provides acceptable results, closely matching the experimental data.
- [Tuo21] Tuo, Z., Yue, Z., Zhuang, X., Min, X., Badreddine, H., Qiu, L., Gao, J., 2021. Comparison of two uncoupled ductile damage initiation models applied to DP900 steel sheet under various loading paths. International Journal of Damage Mechanics 30, 25–45.
- [Pe08] Peterson, R. E., & Pilkey, W. D., 2008. Peterson’s stress concentration factors (3rd ed., pp. 57–134). Wiley.
Leave a Reply
Want to join the discussion?Feel free to contribute!